
Profitability per vehicle: see which vehicles earn money
Calculate each vehicle's real margin using rental revenue and actual costs: insurance, road tax, maintenance, tyres and extraordinary expenses.
Reading time: 9 min
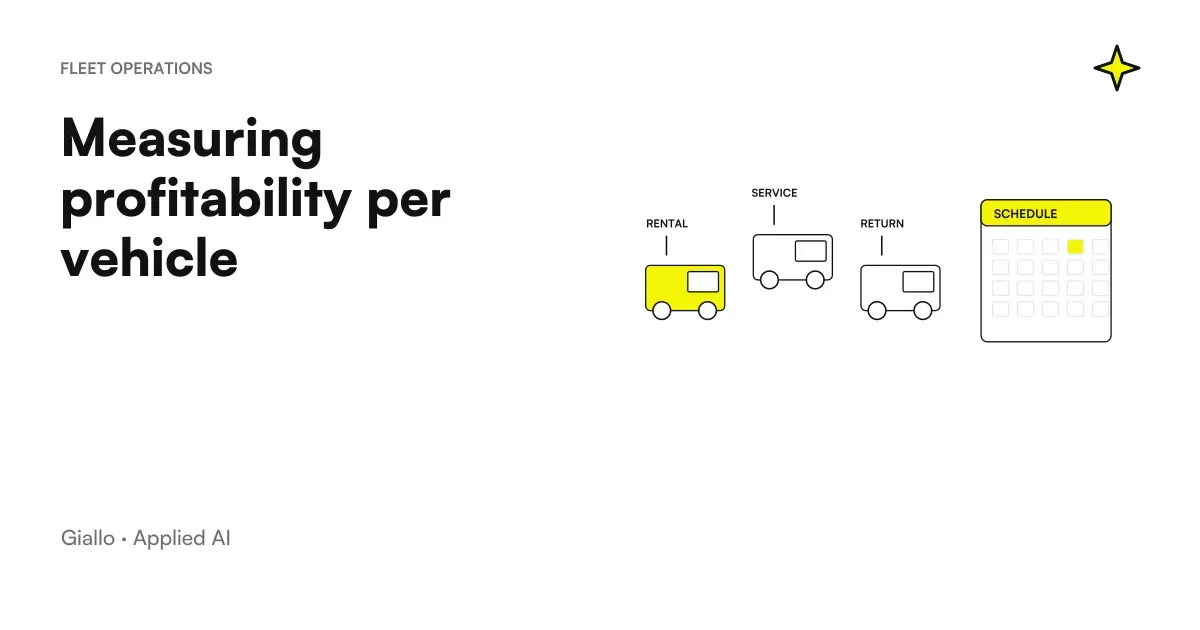
The profitability by vehicle is the bill that puts on one side the revenues of the rentals of a vehicle and on the other its real costs, and shows what is left. It is the passage that transforms a management software from archive to decision tool.
The reason is simple: the turnover of a vehicle is visible and deceptive. A very rented car looks like the best vehicle in the fleet, until you count maintenance and tires that that mileage has produced. Margin tells another story, and sometimes it's the opposite.
This article describes the calculation implemented in CRM for car rental of Rial Rent, on a fleet of 27 cars.
In summary
- The turnover per vehicle is a deceptive fact: the most rented means are also those that cost the most.
- The costs should be attributed to the Single Medium: insurance, stamp, maintenance, tires, overtime.
- Insurance goes compared to months of possession, otherwise the new means seem at a loss.
- The account is formed by itself only if the costs are recorded where they happen, on the middle card.
- The number opens the question, does not close it: it should be read with those who know the vehicle and the market.
What goes into the account
| Voice | Type | Note |
|---|---|---|
| Renting Revenues | Entry | Taken from the contracts of that vehicle in the period |
| Insurance | Cost | Reported to months of actual possession |
| Bollo | Cost | Annual, attributed to the medium |
| Ordinary Maintenance | Cost | Scheduled Cuts and Interventions |
| Extraordinary Maintenance | Cost | Unplanned failures and repairs |
| Tyres | Cost | Trains purchased and fitted |
| Extraordinary Costs | Cost | Damages, claims, exceptional interventions |
What not enter are the general costs of the company — rent, administrative staff, marketing. Not because they do not exist, but because spreading them on vehicles with an arbitrary criterion makes comparison between means less readable: you end up comparing the breakdown instead of the vehicles.
The margin per vehicle serves to answer the question "this means, compared to the others, how does it go", and for that the direct costs are enough.
The detail that changes the result: the pro rata
Insurance related to months of actual possession seems like an accounting detail and is the correction that avoids the most common wrong decision.
A vehicle that entered the fleet in September produced revenue for four months. If he is given the full one-year insurance premium, his margin turns out to be very bad — and the natural conclusion is that that model does not fit. The problem is not the model: it is the denominator.
Because the account is only formed if the costs are recorded where they happen
This is the organizational part, and it is the part that decides whether the calculation really exists or remains an intention.
The costs of a vehicle come at different times and from different sources: a workshop invoice, a stamp payment, a tire receipt. If they are to be collected retrospectively to compile a report, they will not be raccolti or will be once a year, with holes.
The solution is not technical: it is to put the recording point where the cost happens. Maintenance is recorded on the media card when loading the document, as described in Digital Vehicle Documents. The tire train registers when updating the tire situation. At the end of the year the bill is already there, because it was formed during the year.
What makes data reliable
- The cost is recorded at the time and point where it occurs.
- Each cost is connected to a vehicle, not a generic category.
- The annual costs are normalised over the period of possession.
- Revenue comes from contracts, not manual entry.
What Makes It Useless
- The collection of costs takes place once a year, by heart.
- Expenses end in an unattributed general cauldron.
- The annual costs are attributed in full to means owned a few months.
- No one looks at the result, because it never comes in time to decide.
The three decisions that data enables
- Which vehicle to keep and which to replace. A medium with a structurally low margin, not for a crooked year, is an exit candidate.
- On which to raise the tariff. A very popular vehicle but with a thin margin has a price problem, not demand.
- What to buy next time. The margin per model, not per individual specimen, orients future purchases better than any impression.
On all three is worth a warning: the number opens the question. A negative margin may depend on unrepeatable extraordinary maintenance, recent entry into the fleet, a period in the workshop. It should be read along with those who know that vehicle, not applied mechanically.
Revenue per day of availability, not per vehicle
There is a refinement that is worth introducing as soon as the base account works: report revenues to days when the medium was actually available.
A two-month standstill in the workshop did not produce any revenue during that period, but it is not the fault of its economy: it was unavailable. Comparing it at the same year with a fleet vehicle always produces a ranking that measures bad luck instead of profitability.
The corrective is to divide the margin by the days of real availability. It changes the conclusions more often than you think: means that seemed mediocre are excellent but unfortunate, and vice versa.
- Days of possession, to normalize annual costs.
- Days of availability, to normalize revenues.
- Days actually chartered, to measure demand.
- The ratio between the last two is the rate of use, which is a trade lever.
The first two serve to make vehicles comparable; the last two to understand whether the problem is economic or commercial — a distinction that leads to very different interventions.
When the data says something uncomfortable
One account per vehicle also produces results that no one wanted to see: the most beautiful vehicle in the fleet that it does not render, the model purchased with conviction that it has worse margins than the one bought for fallback.
It is the most useful and the most difficult part to use. The risk is twofold: to ignore the data because it does not like it, or to apply it mechanically without context.
How to Read It Well
- Watching at least two periods, not one: a crooked year is not a trend.
- Separate unrepeatable overtime costs from the normal structure.
- Consider the role of the medium: some bring customers even if they make little.
- Discuss it with those who know the market, not just those who look at numbers.
How to Read It Badly
- Decide to sell a medium over a single negative year.
- Ignore the data because it contradicts a belief.
- Compare vehicles with different periods of ownership without normalizing.
- Use it as the sole criterion, without looking at the question.
The theme of how to bring these numbers before those who decide, with the right periodicity, is treated in report automation with AI.
Practical examples
The car that looked the best. The vehicle with the most rental days in the year shows a mediocre margin: high mileage means frequent servicing and two sets of tyres. The conclusion is not to get rid of it, but to raise the rate.
The little-rented vehicle. A few days of use but almost zero costs, and a margin per day of rental very good. The problem is the demand, not the economy of the vehicle: the lever is commercial.
A vehicle entered in September. With the pro rata on insurance the account is legible; without it, it appears at a loss and leads to a wrong conclusion on the model.
A company with means of operation. The same scheme applies to vans, operating machines, rental equipment: cost items change, not logic. The topic of periodic reporting is in report automation with AI.
Mistakes to Avoid
Looking at turnover instead of margin. It is the most visible and the most misleading data.
Spreading overhead costs on vehicles. It makes comparison between means less readable without adding useful information to that decision.
Not normalising annual costs. It produces rankings that depend on when a vehicle entered the fleet.
Collecting costs at the end of the year. It doesn't, and when it does, it's incomplete.
Applying the number without context. A negative margin over a year with an extraordinary repair says nothing about the vehicle.
How to apply it in the company
- List attributable cost items to the individual asset. If a cost item cannot be attributed, leave it out.
- Locate where each cost manifests in the process, and make it register there.
- Normalize periodic costs on the time of actual possession.
- Link Revenue to Good through contracts, not with a manual entry.
- Look at the data with those who know the means: it serves to ask better questions, not to decide for yourself.
If your current management system fails to produce this account, it is one of two cases where the tailored is justified — the complete reasoning is in Custom CRM or off-the-shelf business management software.
Conclusion
The profitability by vehicle is the data that is lacking in almost all general management software, and not due to technical difficulties: because it requires that costs be registered with discipline and attributed to the individual asset. The calculation is a subtraction; the work is all upstream.
The two things that make it reliable: record the cost where it happens, and normalize the annual entries on the period of possession.
Do you want to understand what processes in your company can be automated with AI? Giallo Studio can help you turn the problem into a real workflow. The service is described in custom software and the real projects in Case Studies.
Giallo Studio guides: methodology and sources
How we apply it in the company
Related resources
FAQ
What does it mean to calculate the profitability of a vehicle?
It means placing a vehicle's rental revenue on one side and its actual costs — insurance, vehicle tax, maintenance, tyres and exceptional expenses — on the other, then looking at the difference. This is different from revenue: a frequently rented car can have a thin margin if costs consume it.
What costs should be included?
Costs attributable to the individual vehicle: insurance prorated to the months of ownership, vehicle tax, routine and extraordinary maintenance, tyres and any damage. General business costs should not be arbitrarily allocated across vehicles, as this would make comparisons between them less clear.
Why is insurance related to months?
Because a vehicle that joined the fleet in September has not incurred a full year's insurance cost. Allocating the entire premium to a vehicle owned for only a few months makes it appear loss-making and leads to poor decisions.
What is the concrete purpose of this data?
It informs three decisions: which vehicle to keep or replace, which vehicle's rate to increase and which type to buy next time. Without the data, these choices are based on instinct, which favours vehicles people like rather than those that generate returns.
Do you need software or just a spreadsheet?
A spreadsheet works if someone fills it in consistently, but consistency is precisely what is missing: costs arrive at different times and from different sources. When costs are recorded where they occur — maintenance on the vehicle's record — the calculation builds itself.
What to do when a vehicle's margin is negative?
First understand why: it can be a year with extraordinary maintenance, a recently entered vehicle, or a structural tariff problem. The number opens the question, does not close it: it should be read together with those who know that vehicle and that market.